

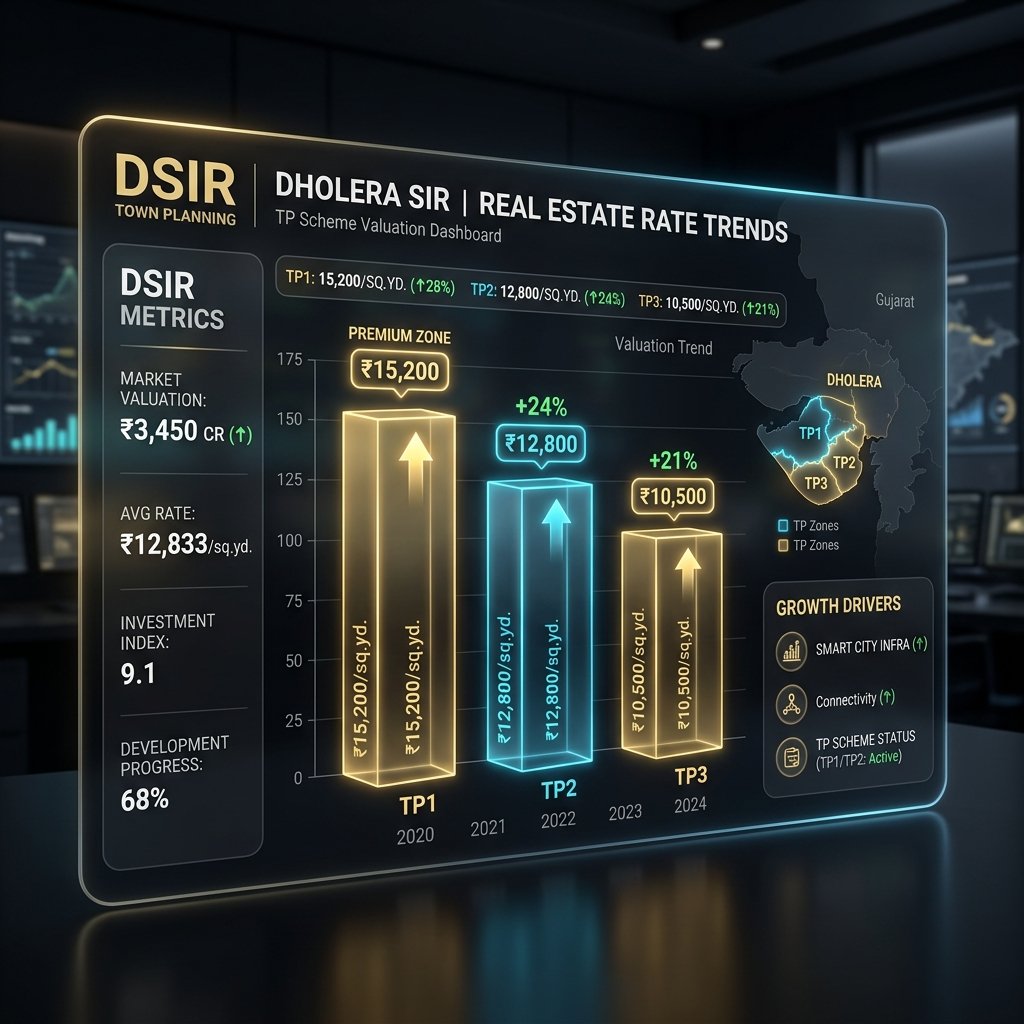

Current Rate Breakdown Across TP Schemes
Land prices in Dholera Special Investment Region vary widely depending on infrastructure readiness, proximity to key corridors (like the Expressway or Airport), and allowed building density.
TP Scheme 1 (Activation Area):
Residential land rates here range from ₹15,000 to ₹22,000 per sq yard. This zone features completed trunk infrastructure, completed sewage grids, and active corporate office buildings (like ABCD).
TP Scheme 2 (Expressway & HAC Corridor):
Commercial and High Access Corridor (HAC) plots range from ₹25,000 to ₹35,000+ per sq yard. These zones are optimized for high-rise commercial structures and are positioned along the transit link.
TP Scheme 3 (Aviation Zone) & TP Scheme 4:
Residential and mixed-use plots range from ₹10,500 to ₹16,000 per sq yard. Valuation here is driven by proximity to the upcoming passenger and cargo airport runways.
Comparative Land Pricing & FSI Matrix
This matrix compares rates per square yard, allowed Floor Space Index (FSI), and core zoning purposes:
| Zone / TP Scheme | Average Price Range (per Sqyd) | Allowed FSI Limit | ROW (Road Access) | Primary Investment Focus |
|---|---|---|---|---|
| TP 1 Residential | ₹15,000 – ₹22,000 | 1.0 to 2.0 | 9 to 18 meters | Immediate residential construction |
| TP 2 Expressway (HAC) | ₹25,000 – ₹35,000+ | up to 5.0 | 55 to 70 meters | High-density commercial, offices |
| TP 3 Airport Zone | ₹10,500 – ₹16,000 | 1.0 to 2.0 | 12 to 30 meters | Hospitality, premium housing |
| TP 5 Heavy Industrial | ₹12,000 – ₹18,000 | 1.2 to 1.8 | 30 to 55 meters | Fabs, logistics yards, supply chain |
Key Takeaways for Investors
- Road Width Determines Value: FSI density buy-up rules are strictly governed by road width. A plot facing a 30-meter road has significantly higher buildable value (FSI up to 2.0) than a plot facing a 9-meter road (FSI 1.0), justifying higher per-square-yard rates.
- Reconstitution Deductions: Remember that during town planning reconstitution, the government deducts approximately 40% to 50% of the land area for public roads and parks. Verified Final Plots (FPs) have already factored in this deduction, so verify whether you are buying on OP (gross) or FP (net) basis.
- Infrastructure Lead Times: While TP1 and TP2 Activation areas command premium prices, early-stage investors looking for maximum growth multiples should target boundary plots in TP3 and TP5.
Frequently Asked Questions (FAQ)
Why are land prices in TP1 higher than in TP5?
TP1 land rates are higher because it is the core Activation Area where physical infrastructure—such as smart grids, sewage networks, and roads—is already complete and operational, reducing development timelines.
Does FSI affect the price per square yard?
Yes, plots with higher allowed FSI (like commercial HAC plots with up to 5.0 FSI) command higher per-square-yard rates because they allow developers to build more floor area on the same land footprint, lowering the cost per buildable square foot.
Download Dholera SIR 2026 Investor’s Kit
Get instant access to the official planning documents: Dholera Investment Handbook (PDF), 2026 Land Price List, TP Zone & Village Map, and the NRI Buying Guide.

Join The Discussion